We're in the process of developing a lab that will enable students to use a phonograph recording lathe to cut a groove into a blank vinyl record, thereby creating a recording of their voice. For that reason, we were interested in this post describing how a phonograph record works:
Here's a link to a Word file describing our efforts thus far:
Does anyone with experience in computer vision have a suggestion for a strategy to digitize the groove in the image of the phonograph record using Snap!
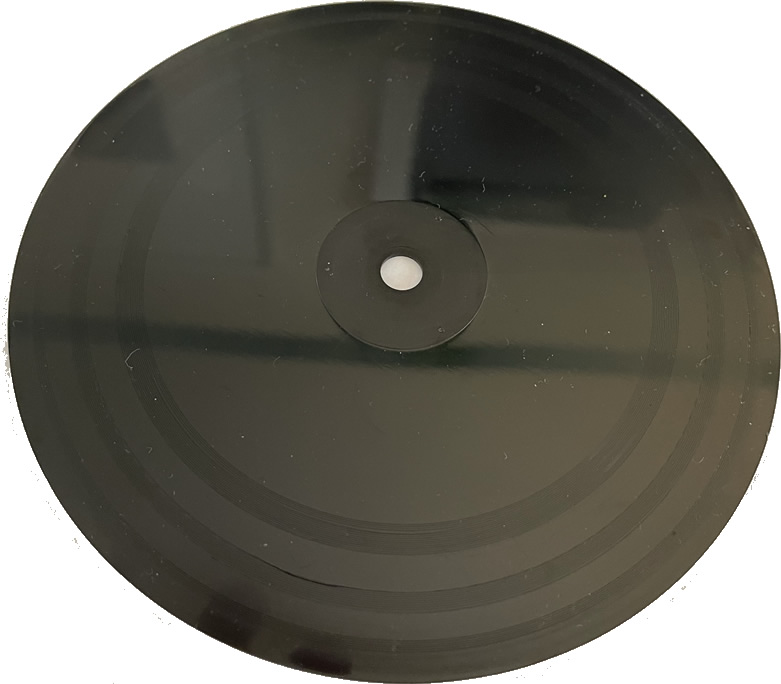
Here is an image of the vinyl phonograph record that we fabricated with a record cutting lathe. You can see the three tracks that were cut into the vinyl near the outer rim of the five-inch phonograph record.
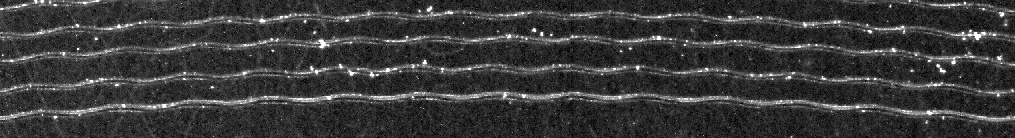
Here are the grooves created by a 250 Hz test tone, The sinusoidal waveform cut into the grooves of the record can be clearly seen in this image obtained through a 2400 dpi scan.
You can't really analyze a sound that's much more complicated than a sine wave. You can take its Fourier transform, of course, but it's hard to disentangle what's a harmonic of another frequency (I mean, what was generated as part of the timbre of an instrument) and what's a separate note, or even the same note played on a different instrument.
But creating a simulated vinyl record should be easy; the sound you already have (in the form of samples) is exactly the shape you want on the record.
Or am I misunderstanding you?
PS In college I took a course on audio, and the thing I still vividly remember from it is a journal article that included electron microscope photos of a vinyl record before and after its first playing. That one playing is enough to put a lot of noise into the grooves! Among other things, I think of that when someone complains about how records are better than CDs (or other digital media) because they're analog and therefore can't have sampling distortion.
You are absolutely right about the wear caused by even a single playing of a vinyl record. Ironically, the older shellac 78 rpm records hold up much better than vinyl.
We're not trying to analyze the waveform. We just would like to construct a good tracing of the waveform; we're currently doing that by drawing over the groove by hand (using a paint program), but it would be neat if this could be done using computer vision in Snap!,.
Hmm I think I would try two sprites, one that follows the spiral and the other having the first one as anchor, including for its direction, which then turns left 90 and moves the (scaled) magnitude of the next sample and then turns right again. Or maybe it'd work to have a third sprite attached to the second, but facing 90 degrees to its left; that way you could leave out the turns.
Why do you need computer vision? Don't you already have the audio samples in the project?
I'm guessing they're exploring how records work, not necessarily trying to get the audio back from a record. Or they could just be trying to make a project that can play audio from an image of a record, which would be cheating if they instead used the original audio files (which kind of undermines the reason to make the project).
Why do you need computer vision? Don't you already have the audio samples in the project? @bh
@ego-lay_atman-bay is correct. We're envisioning that a student might record a short utterance carved into a track on a blank vinyl record. They could then scan the track and import it into Snap!. The imported image could then be digitized with the samples saved in a table. The digitized samples could then be played back using the Play Sound block.
This would enable students to see that the shape of the waveform on an oscilloscopic display (or graphed on the Snap! stage) and the shape of the waveform in the groove of the vinyl record are the same. As Grover notes, this demonstrates that:
This is potentially a great way to demonstrate the round trip from bits (i.e., a digital signal in the computer) to atoms (a groove carved into vinyl) and back again.
This method also is applicable to recovering early recordings of sound. The phonautograph was used to record sound waves on smoke-blackened paper or glass. Phonautograph - Wikipedia
At the time there was no way to play back these recordings, but now they can be recovered. The Smithsonian is using these methods to recover early sound recordings by Alexander Graham Bell.
We have identified three possible strategies for isolating the groove of a sound track in an image imported into Snap!:
Rich Nguyen, a professor of machine learning, suggested that we could use Hysteresis filtering to isolate the groove from its background. We had not encountered use of this term in image filtering before, but found the description below on Quora. We don't know how to implement this type of filter in Snap!, so if anyone has any experience with this type of filtering, suggestions would be welcome:
One defines two threshold values for Hysteresis thresholding. Any pixel which has a value above the higher threshold will be marked 1, and any pixel whose value lies between the higher and lower threshold, but is connected to a pixel whose value is above the higher threshold will also be marked 1. (Pixels marked by 1 are retained while the others are removed.)
This is typically used in edge detection, as pixels connected to an edge pixel are likely to be a part of an edge.
A second strategy might be to cut the groove into a different medium, such as copper tape or aluminum tape, in order to provide more contrast between foreground and background. Use of a strip of copper or aluminum tape could also eliminate issues related to the curvature of the vinyl record.
A third strategy might be to replace the tungsten cutting head that we are employing with a marker, creating a track in dark ink on a strip of chart paper.
Any thoughts or suggestions related to these possible strategies, or a different method that we haven't identified yet, would be very welcome. (Thanks!)
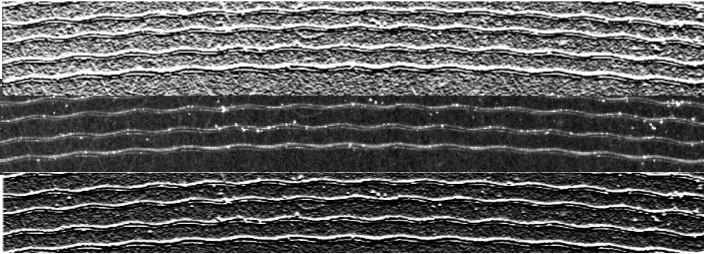
I've made a project to play with 3x3 convolution filters as described (filters are implemented as a hyperized sum of the whole shifted arrays)
Below is a Stage image with 3 segments
Orig > Gaussian > Sobel Y (edge detection) > Sobel Y result
Orig - original record groove image
Orig > Sobel Y result
Even if this is not directly applicable to the problem maybe can be used to further experiments (at least converting to grayscale and threshold cut).
BTW.It seems that there are still some material shavings extruded at the edge of the groove.
Details
The can be used this way
to rectangle array o pixel data. (It's hardcoded for 3x3 "kernel" arrays)
BTW.
The same proces applied to the background image
This is extremely helpful in providing a starting point for further exploration. Tomorrow we're going to investigate use of other materials to see if we can get greater contrast between foreground and background.
There was a time when you could buy, for a few thousand dollars, a turntable that would play vinyl records with lasers. The idea was to avoid further ruining your vinyl records every time you played them. It had to be really precisely installed, leveled and so on, and so part of the purchase price paid for them to send an expert installer from Japan to your house to do it. I vaguely remember that the results weren't perfect but were still better than putting more and more scratches on your records. Maybe someone more search engine literate than I could find the company's white paper on how they read the records. (I'm speaking of them in the past tense because surely by now anything originally released on vinyl has been reissued digitally, not because I know anything about their history.)
Right, I'd forgotten the part about being able to adjust the z-axis position of the simulated stylus to avoid the damage done to the record by your previous turntable. I want one!
Actually the way to make money with this technology would be to sell a service where you send them your records and they send you CDs. Well, I guess that would have worked back then, when hardly anything was on CD. Way too late now.